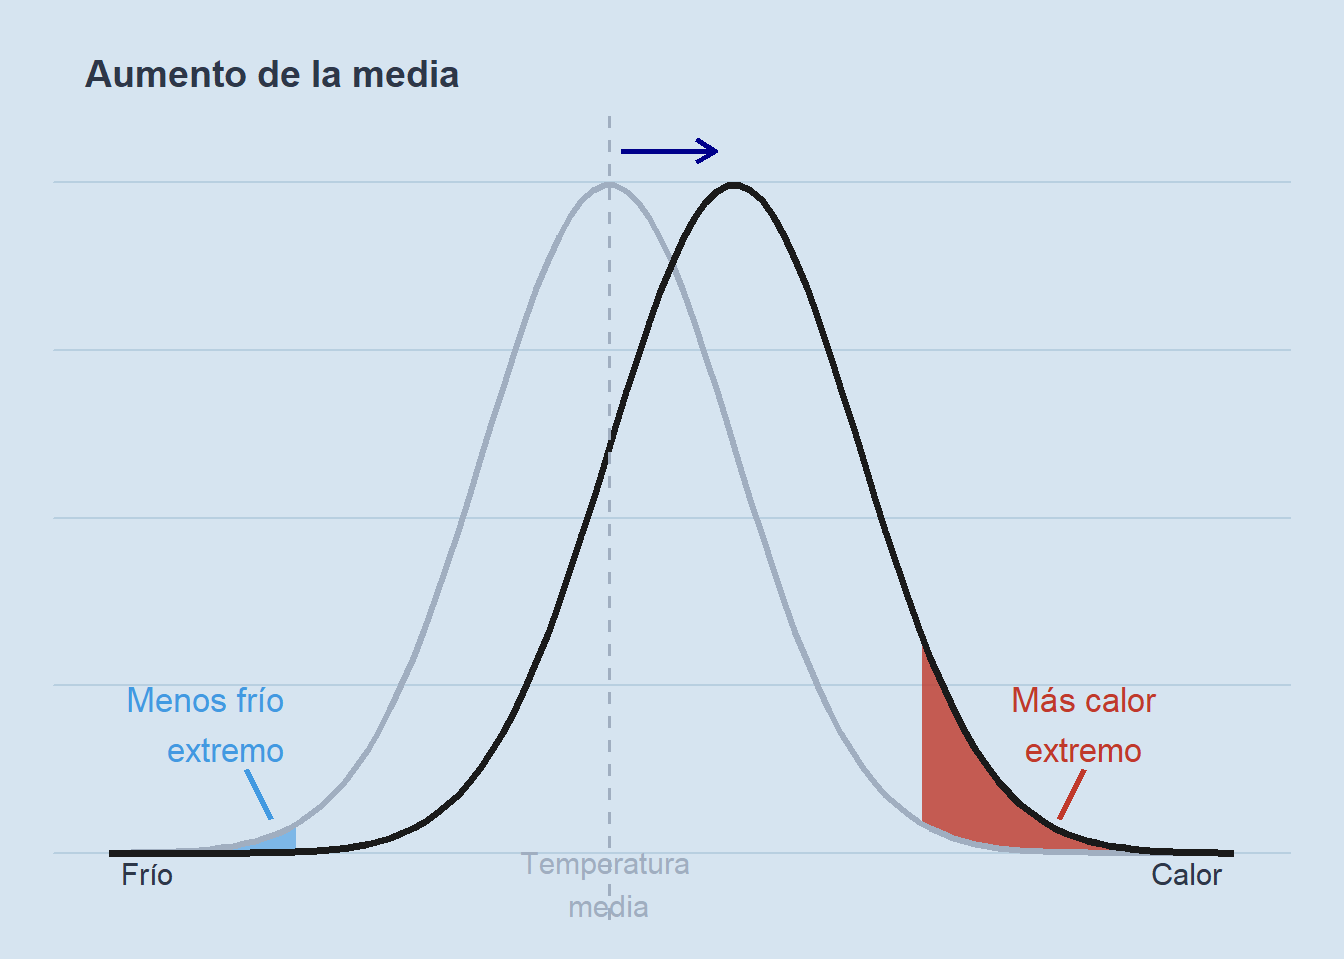
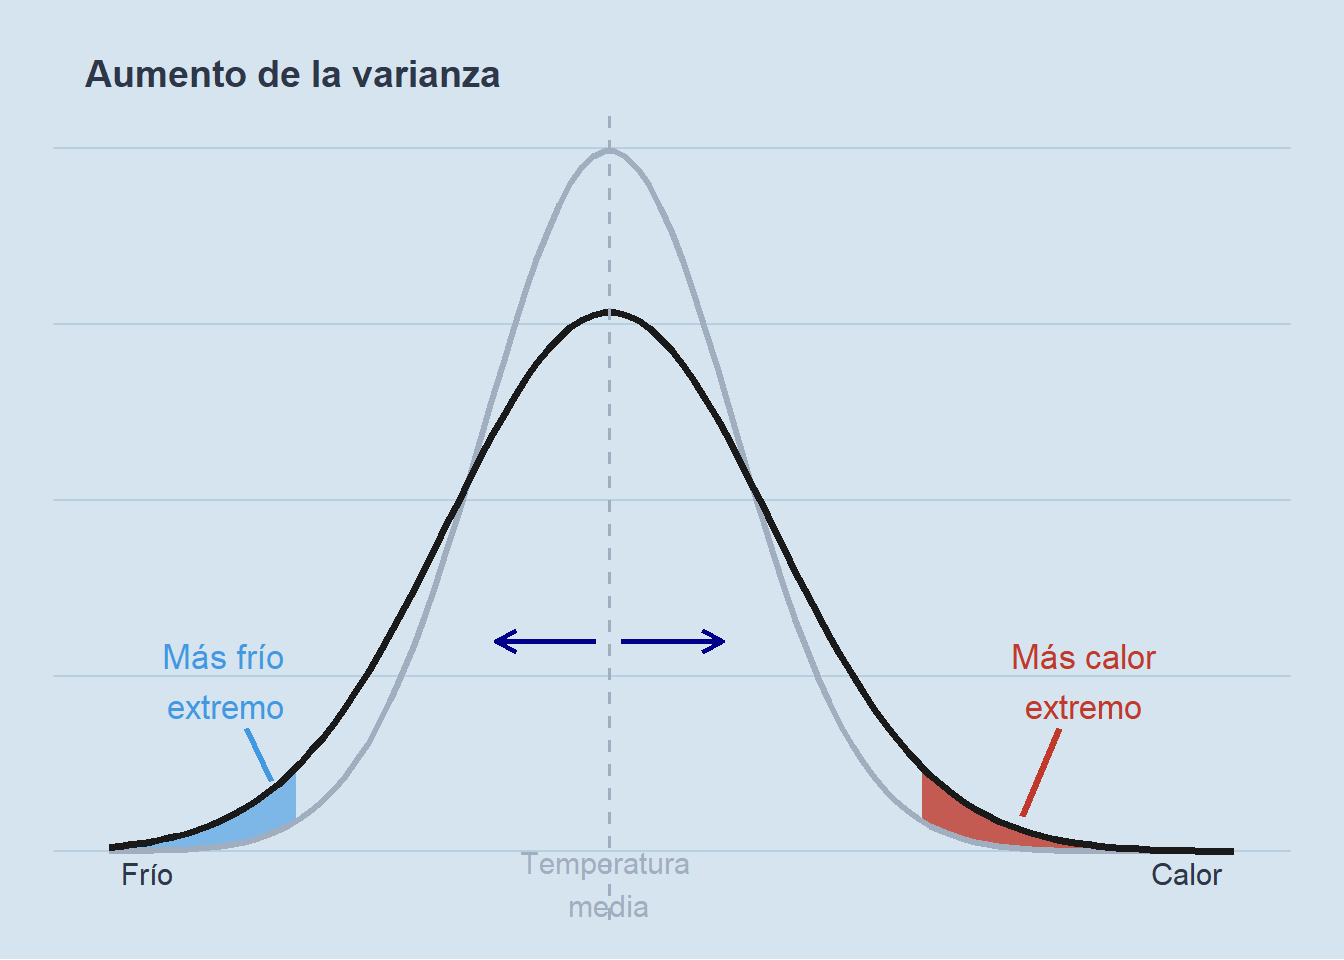
media_ref <- 0;  sd_ref <- 1
media_new <- 1;  sd_new <- 1.3
x_min <- -4;     x_max <- 5
umbral_frio  <- -2.5
umbral_calor <-  2.5

df_frio <- data.frame(x = x_seq) |>
  mutate(
    y_ref = dnorm(x, media_ref, sd_ref),
    y_new = dnorm(x, media_new, sd_new)
  ) |>
  filter(x <= umbral_frio, y_ref > y_new)

df_calor <- data.frame(x = x_seq) |>
  mutate(
    y_ref = dnorm(x, media_ref, sd_ref),
    y_new = dnorm(x, media_new, sd_new)
  ) |>
  filter(x >= umbral_calor, y_new > y_ref)

ggplot(data.frame(x = c(x_min, x_max)), aes(x)) +
  geom_ribbon(data = df_frio,
              aes(x = x, ymin = y_new, ymax = y_ref),
              fill = col_frio, alpha = 0.6) +
  geom_ribbon(data = df_calor,
              aes(x = x, ymin = y_ref, ymax = y_new),
              fill = col_calor, alpha = 0.8) +
  stat_function(fun = dnorm, args = list(media_ref, sd_ref),
                colour = col_curva_ref, linewidth = 1.2) +
  stat_function(fun = dnorm, args = list(media_new, sd_new),
                colour = col_curva_new, linewidth = 1.4) +
  geom_vline(xintercept = media_ref, colour = col_curva_ref,
             linetype = "dashed", linewidth = 0.6) +
  geom_vline(xintercept = media_new, colour = col_curva_new,
             linetype = "dashed", linewidth = 0.6) +
  annotate("segment",
           x = 0.1, xend = 0.85,
           y = dnorm(0, 0, 1) * 1.05,
           yend = dnorm(0, 0, 1) * 1.05,
           colour = "darkblue", linewidth = 1,
           arrow = arrow(length = unit(0.3, "cm"), type = "open")) +
  annotate("segment",
           x = 0.9, xend = 0.1,
           y = dnorm(0, 0, 1) * 0.3,
           yend = dnorm(0, 0, 1) * 0.3,
           colour = "darkblue", linewidth = 1,
           arrow = arrow(length = unit(0.3, "cm"), type = "open")) +
  annotate("segment",
           x = 1.1, xend = 1.9,
           y = dnorm(0, 0, 1) * 0.3,
           yend = dnorm(0, 0, 1) * 0.3,
           colour = "darkblue", linewidth = 1,
           arrow = arrow(length = unit(0.3, "cm"), type = "open")) +
  annotate("text", x = umbral_frio - 0.1,
           y = dnorm(umbral_frio, media_ref, sd_ref) + 0.08,
           label = "Mucho menos\nfrío extremo",
           colour = col_frio, size = 4.5, hjust = 1) +
  annotate("text", x = 4,
           y = dnorm(umbral_calor, media_ref, sd_ref) + 0.09,
           label = "Mucho más calor\nextremo",
           colour = col_calor, size = 4.5, hjust = 0.5) +
  annotate("text", x = x_min + 0.1, y = -0.012, label = "Frío",
           colour = col_texto, size = 4, hjust = 0) +
  annotate("text", x = x_max - 0.1, y = -0.012, label = "Calor",
           colour = col_texto, size = 4, hjust = 1) +
  annotate("text", x = media_ref, y = -0.018, label = "Temperatura \nmedia",
           colour = col_curva_ref, size = 4, hjust = 0.5) +
  annotate("segment",
           x = -2.9, xend = -2.7,
           y = 0.07, yend = 0.02,
           colour = col_frio, linewidth = 1.1) +
  annotate("segment",
           x = 3.9, xend = 3.7,
           y = 0.08, yend = 0.05,
           colour = col_calor, linewidth = 1.1) +
  labs(title = "Aumento de la media y de la varianza") +
  xlim(x_min, x_max) +
  theme_void() +
  theme(
    plot.background  = element_rect(fill = col_fondo, colour = NA),
    panel.background = element_rect(fill = col_fondo, colour = NA),
    plot.title = element_text(colour = col_texto, size = 14, face = "bold",
                              margin = margin(t = 12, l = 12, b = 8)),
    plot.margin = margin(10, 20, 15, 20),
    panel.grid.major.y = element_line(colour = "#b8cfe0", linewidth = 0.4)
  )